How to Optimize Latency for Real-Time AI Search APIs

How to Optimize Latency for Real-Time AI Search APIs
Optimizing latency in real-time AI search APIs is essential for delivering fast and smooth user experiences. Latency directly affects response times and user satisfaction, so reducing delays is critical. Here's a quick summary of the key strategies covered in the article:
- Focus on Query Design: Use concise prompts, reduce unnecessary payloads, and minimize round trips.
- Improve Indexing: Structure data for faster lookups, denormalize where possible, and limit searchable fields.
- Leverage Caching: Use semantic caching to speed up repetitive queries and reduce API costs.
- Optimize Infrastructure: Co-locate servers and databases, use connection pooling, and minimize network overhead.
- Monitor and Test: Track key metrics like p95/p99 latency, perform load testing, and set clear latency budgets.
For example, teams like Ravi Teja Thutari's reduced API latency from 10 seconds to 2 seconds by using Redis caching and optimizing server settings. Similarly, Twitter improved search indexing latency from 15 seconds to 1 second by rethinking their data structures.
Key Metrics to Watch:
- Search Latency: Total time from query to response.
- Tail Latency (p95/p99): Tracks worst-case delays.
- Throughput (QPS): Queries handled per second.
- Error Rates (503s): Highlights service overload.
Understanding Latency in Real-Time AI Search APIs
::: @figure 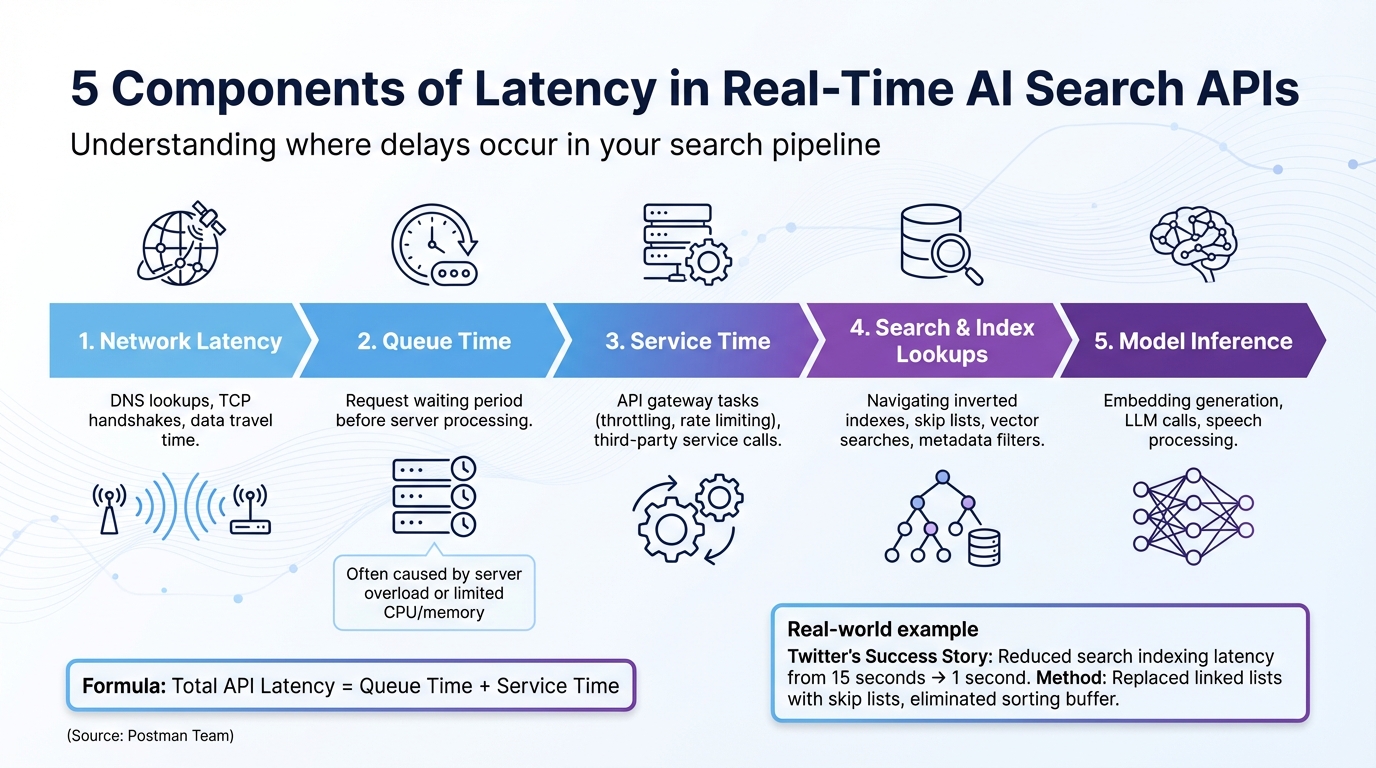 {5 Components of Latency in Real-Time AI Search APIs}
Components of Latency
When it comes to real-time AI search systems, latency is influenced by five key components that collectively determine the total response time. First, network latency includes factors like DNS lookups, TCP handshakes, and the time it takes for data to travel across the network. Then there's queue time, which is the period a request waits before the server begins processing - this often happens due to server overload or limited CPU and memory resources.
"The latency for a single API call should be calculated by adding two values together: the queue time and the service time." - Postman Team
Next is service time, covering operations like API gateway tasks (e.g., throttling and rate limiting) and calls to third-party services. Search and index lookups involve navigating data structures like inverted indexes or skip lists. These processes can slow down when handling large vectors or applying complex metadata filters. Finally, model inference includes tasks like embedding generation, large language model (LLM) calls, and speech processing.
Breaking down these latency components is essential for identifying the right performance metrics to monitor.
Key Metrics to Measure
By understanding latency components, you can focus on the right performance metrics. For search latency, it's important to track both "elapsed time" (how long the search service processes a query) and "round-trip duration" (the total time from the client's request to the final response). For example, in one test, a search service took just 21 milliseconds to process a query, but the total round-trip time was 125 milliseconds - over 80% of the delay came from network latency.
Another critical metric is throughput, often measured in Queries Per Second (QPS) or Queries Per Minute (QPM). Tail latency metrics, such as p95 and p99 response times, are vital for spotting bottlenecks that averages might miss. For instance, while the average latency at 20% load might be 104 milliseconds, the p99 latency could spike to 738 milliseconds. Under heavier loads, like 80%, p99 latency can soar to 1,752 milliseconds. Additionally, error rates, particularly throttled queries (HTTP 503 responses), highlight when a service is maxed out.
Tools for Observability
Once you've identified key latency metrics, the next step is using observability tools to diagnose and address delays. Distributed tracing with tools like OpenTelemetry provides end-to-end visibility across every stage of an AI pipeline, whether it's speech-to-text, LLM calls, or text-to-speech. This helps pinpoint exactly where delays occur. Real-time logging platforms are also helpful for identifying slow-running queries quickly.
Monitoring dashboards allow you to track latency spikes and correlate them with background tasks, such as shard merges or heavy indexing operations that compete for system resources. Setting up real-time alerts for thresholds like throttled query percentages ensures you're immediately notified when the service hits its limit. This enables both automated and manual scaling to maintain performance.
Optimizing Query Structure for Low Latency
Designing Efficient Prompts and Payloads
How you frame your prompts plays a critical role in response time. The key factor? Token volume. Both the tokens in your input and those generated by the model affect latency, with the latter typically being the bigger contributor. Even small tweaks to your prompts can lead to significant speed improvements.
"A few simple phrases in your prompt can speed up your application." - Microsoft Foundry Blog
For vector search queries, you can reduce latency by shrinking the payload size. For example, set include_values=false when you don't need the actual vector data in the response. Skipping large vector values minimizes delays. Similarly, avoid having the model generate predefined text or rewrite lengthy content if code-based edits can handle the task. This approach can deliver up to a 16x speed improvement.
Reducing Round Trips and Request Counts
Every new TCP connection adds overhead, so reusing connections via pooling is a smart way to cut latency. By pooling index connection objects, you can significantly reduce average request times.
In production environments, target your index directly using the host URL instead of relying on "describe_index" operations, which require extra network calls to fetch DNS information. Caching the host URL after the first lookup eliminates this unnecessary step, improving reliability and speed. For applications handling multiple documents or queries, parallelization can make a huge difference. Microsoft demonstrated that parallelizing document classification tasks reduced processing times from 180 seconds to just 2.5 seconds - a 72x improvement.
Streaming responses is another effective technique for improving user experience. By delivering response chunks as soon as they're ready, you reduce "Time to First Token" (TTFT), making your application feel much faster, even if the total generation time remains unchanged.
Beyond connection pooling, caching strategies can further enhance speed.
Leveraging Caching for Faster Responses
Caching can turn repetitive queries from time-consuming processes into almost instant responses. Semantic caching takes this a step further by using embedding models to grasp the meaning behind queries. This allows your system to serve cached responses for similar questions phrased differently - a game-changer for natural language search where users rarely ask the same way twice.
"When your AI application starts incurring $500 daily in OpenAI API costs and users are drumming their fingers waiting 2 seconds for responses, semantic caching isn't just a nice-to-have - it's a lifeline." - Quentin de Quelen, Co-founder & CEO, Meilisearch
Semantic caching can cut response times dramatically, from 19 seconds to just 1.3 seconds - a 14x to 17x improvement. To strike the right balance between accuracy and cache hit rates, set similarity thresholds between 0.85 and 0.95. For search-as-you-type functionality, use a 200ms debounce to reduce redundant requests. Additionally, implement Time-to-Live (TTL) settings to refresh outdated cache entries and provide manual refresh triggers when the underlying data changes.
Indexing and Data Layer Strategies
Once you've optimized queries and connections, the next step to achieving low-latency performance is fine-tuning your data retrieval methods and index design. These strategies build on query optimizations and help streamline data access even further.
Latency-Aware Index Design
The way your indexes are structured plays a significant role in how quickly data can be retrieved. For faster scans, limit the number of searchable fields and use binary quantization, which can speed up index embedding processes by as much as seven times. Reducing the number of searchable attributes directly improves scan efficiency and search speed.
Denormalizing your data is another key strategy. By storing related data together, you can avoid complex join operations that often slow queries down by hundreds of times. For example, mapping numeric IDs as keyword fields allows for much faster term-level lookups. Additionally, for read-only indices, force-merging segments into a single unit simplifies the data structure, enabling your search engine to work more efficiently.
Optimizing Retrieval Parameters
How much data you retrieve is just as important as how you retrieve it. To cut down on data transfer time, fetch only the columns you actually need. For vector databases like Pinecone, if you don't need the actual vector data in your response, set include_values=false to avoid unnecessary retrieval. Large vector representations stored in object storage can add considerable latency.
Another effective approach is to limit top-k results, which reduces both the size of the payload and the time it takes to retrieve data. You can also use metadata filters and namespaces to narrow your search space before performing resource-intensive vector similarity calculations. This ensures the system scans only the most relevant records, significantly cutting down on latency.
Beyond these retrieval optimizations, ensuring data locality and employing efficient caching mechanisms can push performance even further.
Data Locality and Caching
Placing your application servers and databases within the same cloud region is a simple yet effective way to minimize network round-trip times. Similarly, using directly-attached SSDs instead of remote storage helps eliminate communication delays and I/O bottlenecks.
Allocating at least 50% of your server's RAM to the filesystem cache ensures that frequently accessed index regions stay in memory, preventing disk I/O from slowing things down. You can also use a "preference" parameter, such as a session or user ID, to route similar requests to the same shard copies. This approach boosts node-level cache hit rates. For queries involving date fields, rounding "now" to the nearest minute or hour makes those queries cacheable, which can dramatically improve cache performance.
Server-Side and Infrastructure Optimizations
Once you've fine-tuned your query and indexing processes, the next step is optimizing your server infrastructure. This ensures it can handle real-time search traffic effectively without running into performance bottlenecks.
Selecting Latency-Optimized Models
Choosing the right model for the job is crucial. Smaller, faster models often deliver quicker response times. For instance, using GPT-3.5 instead of GPT-4 for simpler tasks like classification or retrieval can result in up to a 4x speed increase in token generation. The trick is to align the model's complexity with the task - there's no need to use a more advanced model for straightforward operations.
Another key factor is token usage. Cutting output tokens by 50% can reduce latency by nearly the same percentage. On the other hand, reducing input tokens has a much smaller impact, improving latency by just 1-5%. This means focusing on response length is far more effective than obsessing over prompt length alone.
These model adjustments pave the way for even greater improvements when combined with concurrency and rate limit optimizations.
Tuning Concurrency and Rate Limits
Managing concurrent requests effectively is critical, especially during peak traffic. For real-time search, parallelizing calls with single query vectors - rather than batching - can deliver up to a 72x speed boost.
To avoid performance bottlenecks, separate workloads by type. For example, keep quick search queries separate from long-running document processing tasks. During periods of high demand, use overflow capacity by routing excess traffic to pay-as-you-go endpoints. This prevents queuing delays that can cripple latency. If rate limits are reached, implementing exponential backoff mechanisms helps protect your servers.
Connection pooling is another game-changer. It eliminates the repetitive overhead of establishing new connections (the three-step handshake) for every request. For serverless setups, provisioned concurrency is a smart way to sidestep cold starts, ensuring functions are ready to execute without delay.
These steps, combined with reducing network overhead, can significantly enhance overall performance.
Minimizing Network Overhead
Network latency can be a silent killer of performance. Co-locating resources - whether in the same cloud region, virtual network, or data center - can cut network round-trip times in half, providing up to a 2x speed improvement.
"Placing the API gateway and the backend microservices... in close physical proximity... can help reduce latency by eliminating the network overhead of communicating across long distances." - Jennifer Craig, Tyk API Gateway
Directly targeting database indexes by their unique DNS host or URL, rather than relying on "describe" operations, can also reduce unnecessary API calls in production environments.
Simplify your architecture by reducing middleware layers between the client and backend services. Every additional "hop" increases latency. Use HTTP/2 with connection reuse (keep-alive) to avoid repeatedly opening new connections. Optimizing TLS/SSL with session resumption techniques can also speed up secure handshakes.
Finally, advanced load balancing can make a big difference. Instead of basic round-robin methods, use latency-based algorithms like Peak EWMA (exponentially weighted moving average) to route traffic to the fastest backend in real time. For applications that rely on high cache-hit ratios, consistent hashing ensures specific client inputs consistently map to the same backend servers, reducing redundant data retrieval.
"The latency algorithm is based on peak EWMA (exponentially weighted moving average), which ensures that the balancer selects the backend by lowest latency." - Kong Gateway documentation
Monitoring and Iteration
Keeping performance optimized isn't a one-and-done task - it requires constant monitoring and adjustment. Metrics need to be tracked, and quick alerts should be in place to address issues as they arise.
Defining Latency Budgets and SLOs
Start by setting clear latency budgets for your pipeline. These budgets should be distributed across backend operations, frontend tasks, and shared responsibilities. A common breakdown looks like this: 40% for backend operations (like database queries, API calls, and third-party integrations), 40% for frontend tasks (such as rendering and loading assets), and 20% for shared elements like network round-trip times and CDN delivery.
When measuring performance, focus on P95 and P99 latency metrics instead of averages, as averages can hide worst-case scenarios. For example, on search or browse pages, a typical P95 target is 2,500 ms, while checkout pages might allow up to 3,000 ms. The stakes are high: every additional 100 ms of P95 latency can cost around 0.7% in conversion rates. For a business generating $10 million annually, that's a potential $70,000 loss for every 100 ms.
Set up alerts that are trend-based rather than triggered by single spikes. For instance, alert if P95 exceeds the budget for five minutes straight, or if P99 crosses the threshold for 15 minutes. Use visual dashboards with color-coded indicators - Green for budgets below 70%, Yellow for 70–90%, and Red for anything over 90%.
Take StyleHub, an e-commerce platform, as an example. They were struggling with a P95 latency of 4.5 seconds. By setting a more realistic goal of 3 seconds and allocating 1 second specifically for image loading, they managed to hit a 2.9-second P95 in just six weeks. The result? A 23% boost in conversion rates.
Load and Stress Testing
To ensure your system can handle real-world traffic, simulate production-like scenarios. Start with incremental load testing: begin at a low query rate (5–10 queries per second) for about 180 seconds, then gradually increase the rate until latency thresholds are breached or success rates drop.
Use at least 10,000 unique queries to minimize the effects of caching. Testing with real production data is key - take snapshots of your actual indexes, including facets, filters, and scoring profiles.
Keep an eye on HTTP 503 errors and background tasks like shard merging to identify capacity limits.
Here's a real-world example: CDON, a Nordic marketplace with 8 million products and 120 million visitors annually, used a snapshot of their production index (6 million documents, 20 GB in size, 250 fields) for benchmarking. Their tests revealed that an S2 tier could handle four times the query volume of an S1 tier, all while maintaining lower average latency.
| Metric | Purpose | Key Indicator |
|---|---|---|
| Elapsed-time | Measures internal service processing | High values suggest inefficient queries or insufficient resources |
| Round-trip duration | Measures client-to-server time | High values relative to elapsed-time point to network bottlenecks |
| QPS / QPM | Tracks throughput (Queries Per Second/Minute) | Helps identify the system's "breaking point" |
| HTTP 503 Rate | Measures service saturation | Indicates when the service is at capacity and needs more replicas |
| Latency Percentiles (P95/P99) | Tracks tail latency | Highlights worst-case delays users experience under load |
These monitoring and testing practices, combined with earlier optimization techniques, ensure your API maintains low latency over time. Tools like Desearch can seamlessly integrate these insights into a unified latency management strategy.
Using Desearch for Observability
Desearch offers a developer dashboard packed with real-time logs and structured JSON responses, making it easier to monitor latency trends in AI search applications. The platform's built-in observability tools help track API usage, error patterns, and performance metrics.
One key feature of the dashboard is its ability to differentiate between "Took Time" (the time spent processing on the server) and "Service Time" (the total time from sending a request to receiving a response, including network latency and serialization). This distinction helps pinpoint whether performance issues are due to internal bottlenecks or external factors like network delays.
Real-time error tracking is another valuable feature. It correlates query patterns with latency spikes, allowing you to experiment with query optimizations in the testing playground. You can immediately see the impact of changes on response times before deploying them to production. This hands-on approach ensures you're always in control of your system's performance.
Conclusion
Reducing latency in real-time AI search APIs requires optimizing every layer of the stack. Efficient queries, smart indexing, and well-tuned infrastructure all play a role - missing one creates bottlenecks.
Focus first on query optimization: short, task-specific prompts, metadata filtering, and caching for repeat queries. On the infrastructure side, use connection pooling and keep services in the same cloud region to reduce network overhead.
Latency optimization is continuous. Monitor P95 and P99 metrics, not averages, and rely on real-time logs to catch issues early. Tools like Desearch help by separating server processing time from network latency, making it easier to keep performance low as systems scale.